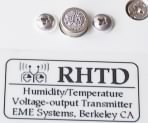
RHTD, IM3602
humidity and temperature probe
using the HIH-3602 sensor
IC
(c) 1998 , 2001 EME Systems, Berkeley CA
U.S.A.
<OWL2
index> <stamp
index> <home>
Contents (updated 9/10/2001)
|
RHTD Temperature/humidity
probe
|
top
|
 EME
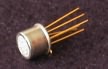
Systems manufactures a temperature/humidity probe, the RHTD,
which is built around the premium HyCAL/Honeywell/Microswitch
model HIH3602 sensor element. The sensor
element includes both the RTD temperature sensor and the humidity
sensor with the signal conditioning electronics integrated in the
package. The humidity senosr has a polymer construction that is
highly resistant to contamination. The whole assembly is enclosed in
a TO5 metal can and protected by with a hygrophobic sintered
stainless steel air filter.
EME
Systems manufactures a temperature/humidity probe, the RHTD,
which is built around the premium HyCAL/Honeywell/Microswitch
model HIH3602 sensor element. The sensor
element includes both the RTD temperature sensor and the humidity
sensor with the signal conditioning electronics integrated in the
package. The humidity senosr has a polymer construction that is
highly resistant to contamination. The whole assembly is enclosed in
a TO5 metal can and protected by with a hygrophobic sintered
stainless steel air filter.
 We
mount the sensor element in a NEMA rated polycarbonate enclosure
along with electronics to buffer the humidity signal and to convert
the RTD signal to a voltage. The RHTD temperature signal is
conditioned to give 0 to 5 volts output for -25°C to +100°C
temperature (1 volt out at 0.0°C, 40 mV/°C
sensitivity.)
We
mount the sensor element in a NEMA rated polycarbonate enclosure
along with electronics to buffer the humidity signal and to convert
the RTD signal to a voltage. The RHTD temperature signal is
conditioned to give 0 to 5 volts output for -25°C to +100°C
temperature (1 volt out at 0.0°C, 40 mV/°C
sensitivity.)
°C=volts*25-25
The output for humidity is a buffered voltage that goes from
approximately 0.8 volts at 0%RH to 4.0 volts at 100%RH.
%RH=(volts-Vo)/S
     Vo: offset value, voltage output at 0%RH (~0.8 volt)
     S: slope value, in volts per %RH (~0.032 volts/%RH)
Each module has slightly different values for the parameters Vo
and S. They are printed on a label on the side of each RHTD. They
enter into the software as described below.
For the following routines, assume that the temperature signal
(green) is connected to OWL2c input #6, and the humidity signal
(white) is connected to OWL2c input #5, and power (red) comes from
the switched battery supply.
The humidity sensor has a temperature dependence, which is
strongest when the humidity is highest. The following routine first
measures the temperature, then the raw humidity, and then applies the
temperature correction to find the compensated humidity.
result var word  ' from AD converter millivolts
ADch   var nib   ' AD converter channel
Trh    var word  ' temperature 'C*10
RH     var word  ' humidity %RH * 10
' routines EElog and show1 are standard OWL utility subroutines

RHTD_temperature:
' air temperature from RHTD, 12 bits
' -25'C is 0.0 volts, +100'C is 5.0 volts to 0.1'C
  ADch=5              ' analog input 6
  gosub ADread        ' get reading
  result=result/4-250   ' convert to temperature, 40 millivolts/degC
  Trh=result            ' hang onto the temperature result
  gosub EElog2        ' log as -250 to +1000
  gosub show1         ' display -25.0 to +102.5 +/- 0.1 deg. C

RHTD_humidity:
' air humidity from RHTD, 8 bits
' 0% RH is 0.8 volts, 100%RH is 4.0 volts nominal
' from HyCAL certificate:
'       Vo at 0%RH around 0.8 volts
'       S slope around 0.032 volts per %RH
'       calculate stamp multiplier, RHS=65536*100/320=20480
'       except use exact S from calibration tag, instead of 320
  RHV0  con 800    ' millivolts out at 0%RH (from calibration tag)
  RHS   con 20480  ' multiplier, slope
  ADch=4           ' analog input 5
  gosub ADread     ' get results, millivolts from sensor
  RH=result min RH0-RH0**RHS
  ' now have raw humidity*10  value, 0-1000
  ' and next comes temperature (Trh) compensation
  if Trh.bit15=1 then Tnegative
Tpositive:
  RH = RH/5*((902+(Trh**30179)-(Trh/10*Trh**201))/5)/40
  goto rhtdone
Tnegative:
     RH = RH/5*((902+Trh+(Trh**20578)-(Trh/10*Trh**1180))/5)/40
rhtdone:
     gosub show1      ' display as 0.0 to 100.0 +/- 0.1% RH
  gosub EElog      ' store as 0->1000
More about the math, and calibration constants in the
program
The slope multiplier, RHS, and the offset RHV0 are entered as a
constants in the above routine. Alternatively, they could be entered
as DATA, which could be modified by the user in response to prompts
at run time.
|
Here is the logic behind the slope multiplier, RHS. If
the calibration label on the RHTD states a formula of
Vo=0.789 and S=0.0320, then the reasoning proceeds as
follows.
%RH = (V-Vo)/S                   ' formula in volts to %RH
%RH  = (mV - mVo)/(S * 1000)     ' same in millivolts
%RH * 10 = (mV - mVo)/(S * 100)  ' Left side in %RH * 10
%RH * 10 = (mV - mVo)*{100/(S * 10000)}  ' decimal in S moved 4 places right
                                 ' eg 321 instead of 0.0321
The fraction in parentheses on the right will be
something like 100/321, which for the stamp we approximate
closely as 20480/65536. This is the factor RHS entered as a
constant in the above program.
|
If the multiplier is stored as DATA instead of as a constant, the
user could be prompted to enter precalculated value, 20480, or they
could be prompted to enter the slope value S=0.00320 (or whatever it
is) from the calibration label. If they enter the S value, as a whole
number like 320, then the multiplier RHS has to be calculated, as
follows:
RHS = 51200/S*128 + 51200//S*128/S
This value can be stored in the eeprom as DATA. (The integer math
operations in this last formula do not overflow since we know that
the slope (S*10000) will be near the value 320.) Similarly, the user
can be prompted to enter the value for Vo in millivolts, found on the
calibration tag, and this value can also be stored in the eeprom as
DATA.
Temperature compensation, and inside scoop
on the HIH3602 sensor
 The
RHTD probe is built around the HIH3602 humidity sensor chip. This
chip consists of a humidity dependent capacitor and a precision RTD
temperature probe mounted under a stainless steel sintered filter.
The voltage output is a linear function of humidity. That is,
provided the temperature is held constant, the plot of senor output
voltage vs humidity is a straight line. However, the slope of the
line is slightly different at different temperatures, as shown in the
graph to the left. This data comes from the Hycal literature. The
temperature effect is negligible at 0% RH, that is, the offset Vo is
not affected by temperature. Only the slope needs temperature
compensation.
The
RHTD probe is built around the HIH3602 humidity sensor chip. This
chip consists of a humidity dependent capacitor and a precision RTD
temperature probe mounted under a stainless steel sintered filter.
The voltage output is a linear function of humidity. That is,
provided the temperature is held constant, the plot of senor output
voltage vs humidity is a straight line. However, the slope of the
line is slightly different at different temperatures, as shown in the
graph to the left. This data comes from the Hycal literature. The
temperature effect is negligible at 0% RH, that is, the offset Vo is
not affected by temperature. Only the slope needs temperature
compensation.
The first step in the above PBASIC routine, after acquiring the
voltage output of the humidity sensor, is to convert the voltage to a
raw humidity reading. This should be very close to the actual
humidity (+/- 2%) if the temperature happens to be 25 degrees Celsius
(77 deg. Fahrenheit). In fact, if the temperature varies over only a
narrow range of room temperatures, and the humidity is restricted to
mid-range values, further temperature compensation may not be
necessary.
 The
next step applies the temperature correction, for deviations from 25
degrees Celsius. On the above graph, notice the open V-shaped curve
traced out by the upper end of the bars. The graph to the right shows
the same curve, the 100% raw humidity reading, as a black line with
black dots.
The
next step applies the temperature correction, for deviations from 25
degrees Celsius. On the above graph, notice the open V-shaped curve
traced out by the upper end of the bars. The graph to the right shows
the same curve, the 100% raw humidity reading, as a black line with
black dots.
The green straight line is the temperature compensation equation
given in the HIH3602 data sheet, an almost linear fit around 25
degrees C.
%RH := %RH/(1.0546-0.00216*T)
Observe that this is not at all a good fit for temperatures
further from 25 degrees C. I am really surprised that formula is
presented in the manufacturer's data sheet without further
qualification nor comment.
The red curve is my own quadratic approximation that works better
over a wider range, from -20 to +65 degrees C. The temperature
response has a cusp at zero degrees C, so two separate polynomials
are called for.
If temperature T>=0 degrees Celsius, to convert from raw %RH to
temperature compensated %RH:
%RH := %RH*(90.2 + 0.4605*T - 0.00307*T2 )/100
if temperature T<0 degrees Celsius:
  T=ABS(T)   ' make T positive
  %RH := %RH*(90.2 + 1.314*T - 0.018*T2)/100
You may find the the presentation of the manufacturer's data
strange, as did I. The "compensated" humidity values at some points
exceed 100%. This is simply an artifact of the extrapolation of the
"compensated RH" to the value it would have if the "raw uncompensated
RH" were 100%, when in fact the raw uncompensated humidity will never
ever reach those values.
|
Here is the logic behind the translation of the above
formulae to the integer math of the BASIC Stamp. Each of the
multipliers is rewritten so as to use the ** approximation
with the implied denominator of 216.
0.4605  ~= 30179/65536
0.00307 ~= 201/65536
1.314   ~= 1 + 20578/65536
0.018   ~= 1180/65536
This results in translations of the quadratic expressions
for the positive and negative cases. The value of Trh going
into this formula will be from 0 to 650 representing Celsius
temperatures from 0 to 65.0:
Q = 902+(Trh**30179)-(Trh/10*Trh**201)

Q = 902+Trh+(Trh**20578)-(Trh/10*Trh**1180)
This results in a compensation value from 902 to 1070
over the temperture range. The variable RH at this point is
10*humidity. To bring the calculation into range we might
divide the values by 10 before the multiply and then divide
by 10 at the end . To keep the highest resolution, we have
to play with the numbers:
RH = (RH/10) * (Q/10) / 10
   = (RH/5) * (Q/5) / 40   ' 0.1% resolution
That would give the %RH directly with 0.1% resolution,
which tracks small changes, even though the sensor is not
accurate at that level. Another option would be to divide by
200 and then multiply times 5,
RH = (RH/5) * (Q/5) / 200 * 5 ' 0.5% res
which would give a display and resolution to 0.5%RH.
|
Caveat: The data on which this equation is based come from
literature provided to me by the original manufacuter (Hycal) at one
point in time as "typical" of the sensor response over the wide
temperature and humidity range. I have tried to get further
information about the calibration from the current manufacturer
(Honeywell/Microswitch), but they can not or will not verify that the
above curves are still valid. They still do provide a two point
calibration at 25°C with each individual sensor. They do not
supply any information about the shape of the temperature
compensation at negative temperatures, which is odd, considering that
the data sheet claims an operating temperature range from -40 to +85
degrees Celsius. The data sheet still includes only the quasilinear
temperature compensation formula shown as the green line in my graph
above, without comment or qualification. My dismay at the lack of
solid qualification data is balanced by my admiration for the basic
design and ruggedness of the HIH3602 product. At EME Systems, we want
to be honest about the performance of the product.
We have recently discontinued our use of theHIH3602 for the most
part, and have switched to the all digital SHT15
from Intersema. It is much easier to use in a digital system, and
much easier to have confidence in its calibration.
<top>
<OWL2 index>
<Stamp index>
<home>  < mailto:info@emesystems.com
>
< mailto:info@emesystems.com
>